Temporal distribution
In statistics, a temporal distribution is a function that maps probability of occurrence or extent of an event to time. This generally means the variation of a distribution over time, which also describes a temporal distribution..[1] For instance, showing birth rates for months or years on a chart represents a temporal distribution. In different cases, time can be measured in the usual sense, with exact dates, but it can also be categories, like months, or days of the week, or be relative, as in days before/after a certain event. Many graphs that show data over time can be thought of as temporal distributions, but the point of a temporal distribution is not simply showing changes through time, like a line chart of a trend or a time-distance diagram, but showing the nature of a phenomenon, or event, like a probability distribution.
Similarly to probability distributions, temporal distributions can either be continuous or discrete. In the discrete case, the function maps discretely, to separate points in time. In the continuous case, the extent, or probability of occurrence of an event between two points in time, can either be derived from calculating the size of the area under the curve of the function between these two points, or the function simply shows the probability of an event occurring before a certain time.
Temporal distributions are useful for describing a great number of events, like achieving scientific impact[2] or measuring the growth rate, default probability or job allocation of a firm[3]
Examples[edit]
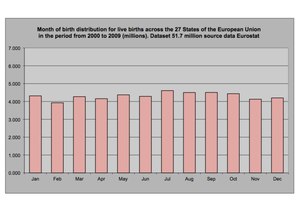
An example of a discrete temporal distribution, with categorized time is the mapping of birth rates to months of the year. In this case, the extent of an event, which is a birth is measured, and corresponded to each month as the sum of all people born in that month, regardless of the year.

The ecological succession of fire hit areas, can be described using a continuous temporal distribution with relative time. For instance, we can look at the probability of the event of the first one of a certain kind of plant sprouting in an area, in a continuous way. Such a function can show, that at the point, where 20 years have passed after a fire, what are the chances that the first pine tree after the fire has already sprouted.

Temporal distributions are also useful in epidemiology, where one can describe the number of infections through time, either in an absolute sense, or in different communities, relative to the outbreak of an epidemic. Categorized time can also be used, like measuring the number of bronchitis infections in different months of the year. Here the extent of the event of an infection is measured. In a different, but still epidemiological sense, the generation time of a disease - shown for influenza - is a continuous temporal distribution, with relative time, where the area under the curve between two time points represents the probability of a new infection occurring, in that time-frame, after the previous infection.
References[edit]
- ↑ "temporal distribution". TheFreeDictionary.com. Retrieved 2017-05-27.
- ↑ Sinatra, Roberta (2016). "Quantifying the evolution of individual scientific impact" (PDF). Science. 354.
- ↑ Thomas F., Cooley (2001). "Financial markets and firm dynamics". The Journal of Risk Finance. 7. JSTOR 2677926.
This article "Temporal distribution" is from Wikipedia. The list of its authors can be seen in its historical and/or the page Edithistory:Temporal distribution. Articles copied from Draft Namespace on Wikipedia could be seen on the Draft Namespace of Wikipedia and not main one.