Iso-ROI model

The Iso-ROI model is a high-level performance measurement model for manufacturing companies. The model is based on the parameters “Throughput”, “Operating Expenses” (OE) and “Investments” and their derived variables “OE-Productivity” and “Investment-Productivity”. The model shows the two productivity variables and their resulting ROI (Return on Investment) in a graph. Moreover, the model helps focusing improvement actions by showing the productivity variable with the highest leverage.
Introduction[edit]
As ROI equals “Profit / Investments”, better ROI can be increased by increasing profit or by decreasing investments. It can be observed, that management focus lays mainly on increasing profit, whereas decreasing investments is at best temporarily focused. The reason for this is that investment productivity is rarely integrated in the MBO targets of the leaders. The Iso-ROI model proves that to increase ROI, investment productivity and OE productivity both have to be considered on equal footage. It even helps focusing improvement actions by showing the productivity with the highest leverage.
Concept[edit]
Basic parameters of the model are “Throughput” (T), “Operating Expenses” (OE) and “Investments” as described by Eliyahu M. Goldratt’s in his “Theory of Constraints” literature including the “Haystack Syndrome”.[1]
They are defined as:
with:
“Turnover” is sales
“Total Variable Costs” is the cost of purchased components
"Operating Expenses" (OE) are all other costs of the company like all salary, wages and all indirect costs which cannot be directly attributed to the products sold, like for example working clothes or energy
hence:
"Throughput" (T) is the value-add part of the proper operations. It is calculated by deducting form every sold product, the cost of the supplier’s components in this product.
The classical calculation of ROI is quite straightforward:
with:

“Investments” are all the elements on the active side of the balance sheet, mainly consisting of machines, inventory and facilities.
The ISO-ROI model, as described in the publication “Key Performance Indicators in Operations”[2] by the author L. Bierens proves that ROI can also be written as:

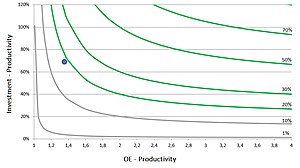
Graphical presentation of the relationship between ROI (Iso-ROI-lines starting at 1%) and OE-Productivity (x-axis) and Investment-Productivity (y-axis)
calling:
: Investment-Productivity
: OE-Productivity
The charm of this formula is, that it calculates “Return on Investment” (ROI) by using the parameter "Throughput" and without using the parameter “Profit”. This makes the model interesting for KPI (Key Performance Indicators) cockpits, MBO (Management by Objectives) for lower management and team members-oriented bonus models.
Graphically, the formula can be visualized as shown on the right.
The model shows the two productivity variables and their resulting ROI in a graph. Moreover, the model helps focusing improvement actions by showing the productivity variable with the highest leverage, as describe below.
Calculating example[edit]
Assume a company has the following results in a given time period:

| Throughput: | 400 CU* |
| Operating Expenses: | 300 CU |
| Investments: | 600 CU |
(*) CU: Currency Units
Using the above formulas, one can calculate:
OE-Productivity: 1,33
Investment-Productivity: 66,6%
Bringing these points on the x- and y-axis of the graph, we get exactly the blue dot in the above figure. By interpolating between the closest iso-ROI lines, we find for ROI approximately 17%.
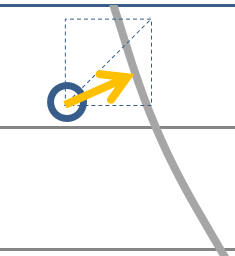
Based on the position of the “dot” in the graph, one can derive an interesting improvement strategy. Namely should the company (or factory) focus more on OE-productivity or Investment-productivity?
Of course, every company should focus on optimizing both OE-productivity and Investment-productivity, but clearly the focus can lay more on the first or the ladder. In a general way, one can observe: is the vector starting from the blue dot to the next Iso-ROI line closer to horizontal, more focus should be laid on OE-productivity. Is the line closer to vertical, more focus should be laid on Investment-productivity.
Summary[edit]
In summary, the Iso-ROI-model is a powerful management tool, as it:
- Integrates Investment-Productivity in the operative key performance indicators
- Offers a seducing graphical presentation, showing the improvement path over time
- Gives clear direction to the continuous improvement efforts
- Is suited for bonus models for lower management and team members of the company
References[edit]
- ↑ Goldratt, E. M. 1990. The Haystack Syndrome: Sifting Information Out of the Data Ocean. New York: North River Press. ISBN: 9780884271840
- ↑ Bierens, L. 2018. Key Performance Indicators in Operations: Build-up a logical KPI-Pyramid. Kindle Desktop Publishing ISBN 9781723899829 Search this book on
 .
.
This article "Iso-ROI model" is from Wikipedia. The list of its authors can be seen in its historical and/or the page Edithistory:Iso-ROI model. Articles copied from Draft Namespace on Wikipedia could be seen on the Draft Namespace of Wikipedia and not main one.


