LabPlot
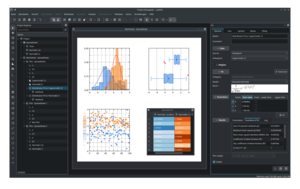
 Screenshot of LabPlot of 2022 | |
| Original author(s) | Stefan Gerlach |
|---|---|
| Developer(s) | KDE |
| Initial release | 2001 (version 0.1, under the name QPlot) 2003 (version 1.0, renamed to LabPlot) |
| Stable release | 2.11.1
/ 16 July 2024[1] |
| Repository | invent |
| Written in | C, C++ |
| Engine | |
| Operating system | Microsoft Windows OS X Linux FreeBSD Haiku |
| Type | Scientific plotting Data analysis Curve fitting Regression analysis Statistical analysis Data processing Plot digitization Notebook interface Real-time data |
| License | GPL-2.0-or-later |
| Website | labplot |
![]() Search LabPlot on Amazon.
Search LabPlot on Amazon.
LabPlot is a free and open-source, cross-platform computer program for interactive scientific plotting, curve fitting, nonlinear regression, data processing and data analysis. LabPlot is available, under the GPL-2.0-or-later license, for Windows, macOS, Linux, FreeBSD and Haiku operating systems.
It has a graphical user interface, a command-line interface and an interactive and animated notebook interface to mathematical and statistical packages and programming languages.
See also[edit]
Some use of "" in your query was not closed by a matching "".Some use of "" in your query was not closed by a matching "".
- List of statistical software
- List of information graphics software
- Comparison of numerical-analysis software
References[edit]
- ↑ "LabPlot 2.11.1 – LabPlot". 16 July 2024.
External links[edit]
| This KDE-related article is a stub. You can help EverybodyWiki by expanding it. |
This article "LabPlot" is from Wikipedia. The list of its authors can be seen in its historical and/or the page Edithistory:LabPlot. Articles copied from Draft Namespace on Wikipedia could be seen on the Draft Namespace of Wikipedia and not main one.

